If you’re just getting started with statistics or data analysis, you may have come across the terms CDF and PDF. These stand for Cumulative Distribution Function (CDF) and Probability Density Function (PDF), and they are crucial concepts in probability and statistics. Understanding the difference between the two—commonly referred to as cdf vs pdf—helps in interpreting data correctly and making better predictions.
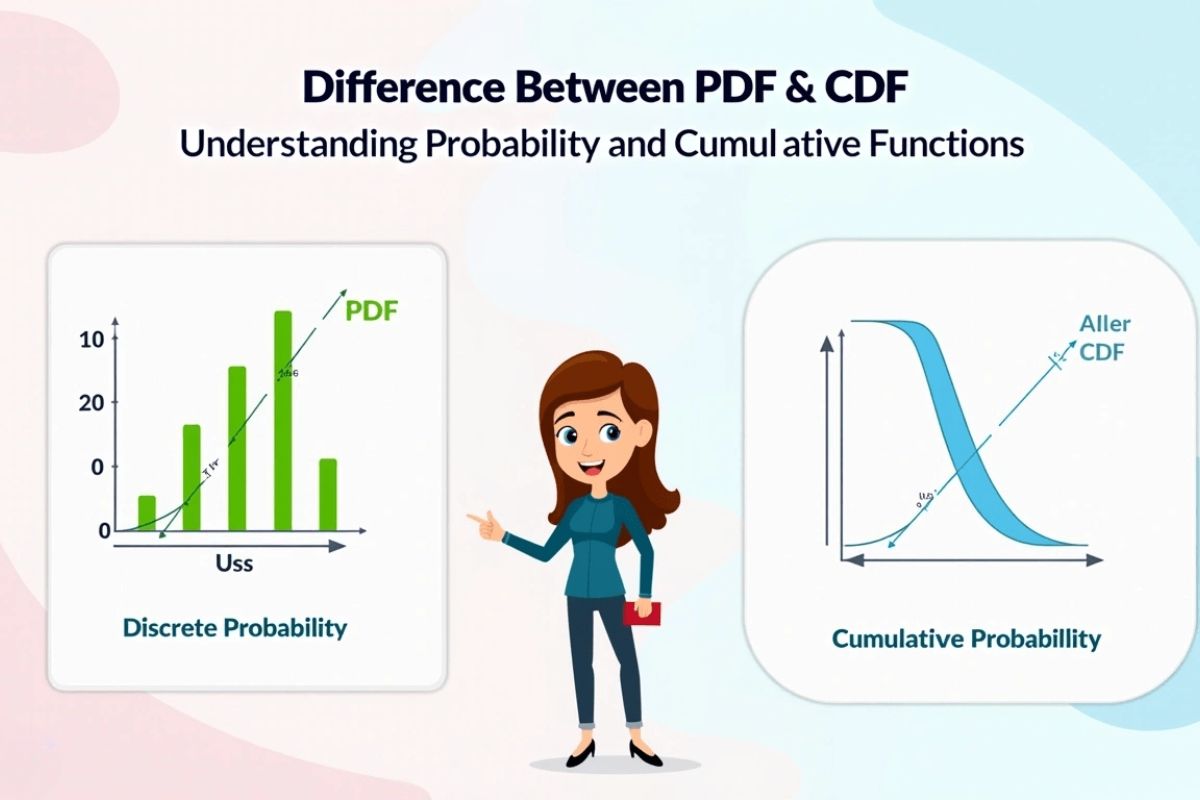
Both CDF and PDF are used to describe distributions, but they do so in different ways. PDF tells you how likely a certain value is, while CDF tells you the cumulative probability up to a certain value. This article will walk you through their definitions, uses, and differences in simple English.
Key Points:
- PDF shows the likelihood of a specific value.
- CDF shows the total probability up to a value.
- Both are essential in statistics and machine learning.
What Is a PDF (Probability Density Function)? — First in cdf vs pdf
A Probability Density Function (PDF) describes the likelihood of a random variable to take on a specific value. In continuous distributions, the PDF is a curve, and the area under this curve between two points represents the probability that the variable falls within that range.
For example, imagine you are measuring the heights of adult men in a town. If most men are around 175 cm tall, the PDF curve will peak at that height. The curve will be lower at very short or very tall heights, reflecting that those values are less likely. However, the probability of any exact height is zero in continuous distributions. Instead, we talk about the probability of the height being within a certain range, such as between 170 cm and 180 cm.
Comparison Table 1: Basic Characteristics of PDF
| Feature | Description |
|---|---|
| What it shows | Probability over a range of values |
| Shape | Curve (area under curve = 1) |
| Exact value probability | Always zero for continuous variables |
| Common usage | Density estimation, data modeling |
Note: Always interpret PDF as the area under the curve, not the value at a point._
What Is A CDF (Cumulative Distribution Function)?
A Cumulative Distribution Function (CDF) gives the probability that a random variable is less than or equal to a certain value. It adds up all the probabilities from the beginning up to that value, hence the word “cumulative.”
Going back to our height example, if the CDF at 175 cm is 0.6, it means that 60% of men are 175 cm tall or shorter. The CDF always starts at 0 and increases to 1. The curve is usually upward-sloping and never decreases because the cumulative probability only increases. When comparing CDF vs PDF, the CDF is more useful for threshold decisions, while the PDF reveals where data values are concentrated.
Comparison Table 2: Basic Characteristics of CDF
| Feature | Description |
|---|---|
| What it shows | Total probability up to a value |
| Shape | Always non-decreasing |
| Final value | Always reaches 1 |
| Common usage | Probability calculation, threshold setting |
Reminder: Use CDF to determine thresholds or ranges in decision-making.
How Do CDF and PDF Work Together? (cdf vs pdf in Practice)
PDF and CDF are closely related. You can get the CDF by integrating the PDF, and you can get the PDF by differentiating the CDF. Think of PDF as the rate of change of the CDF. They work hand-in-hand in describing the behavior of random variables.
For example, in machine learning, you might use the PDF to understand how your model’s predictions are distributed. But if you want to know the chance of the prediction being below a certain value, you’ll use the CDF.
Using both together gives a more complete picture. For instance, a PDF might show that most customers spend around $50, but the CDF will help you understand that 80% of them spend less than $60. This insight is helpful in business forecasting and planning.
Why Are CDF And PDF Important In Real Life?
These functions are not just theoretical—they have real-world uses. For example:
- In weather forecasting, PDF can help predict the likelihood of temperature ranges.
- In finance, CDF is used to determine the probability of stock prices falling below a threshold.
- In machine learning, both are used for building and interpreting probabilistic models.
Understanding these functions can help analysts, engineers, and decision-makers make better predictions and policies.
Another practical application is in quality control. If you manufacture light bulbs and want 95% of them to last more than 1000 hours, you would use the CDF to find the probability of failure before that point. mavuika.org
Which One Should You Use?
Use PDF when you are interested in knowing how values are spread or clustered in your data. It helps identify the likelihood of various values. Use CDF when you want to understand cumulative probability or need to set limits or thresholds.
In hypothesis testing, CDF is used to determine p-values, which are crucial for decision-making. PDF, on the other hand, is useful in identifying patterns and understanding underlying data distributions.
So, your choice depends on what kind of insight you are looking for. If you’re making a decision based on a probability limit, go with CDF. If you’re analyzing how your data behaves, choose PDF. mavuika.org
Conclusion
Understanding the difference between CDF and PDF is vital for anyone working with data. While the PDF helps you understand the distribution of values, the CDF helps you make cumulative comparisons. These tools are foundational in statistics, data analysis, and machine learning.
Whether you’re a student, data analyst, or researcher, knowing how to use these functions will help you draw more accurate and meaningful insights from your data.
FAQ’s
- What is the main difference between CDF and PDF?
- PDF shows the probability of values in a range, while a CDF shows cumulative probability.
- Can the PDF be greater than 1?
- Yes, the PDF value can be greater than 1, but the total area under the curve is always 1.
- Is the CDF always increasing?
- Yes, the CDF is a non-decreasing function and always goes from 0 to 1.
- Where are CDF and PDF used in real life?
- They are used in finance, weather prediction, machine learning, and quality control.
- Can we find the CDF from the PDF?
- Yes, CDF is the integral of the PDF over the range of values.